New Analytics Access

New Analytics can be accessed from Course Navigation [1]. By default, this link is hidden in Course Navigation in each course and must be enabled.
To enable New Analytics, open Course Settings and view the Navigation tab. Move the New Analytics link to the enabled section and save the page.
You can also access New Analytics from the New Analytics button in the Course Home Page [2].
Note: Admins can remove the New Analytics LTI from Account Settings. If the New Analytics link is not available in the Navigation tab for a course, New Analytics is not available for the entire institution.
When Would I Use New Analytics?

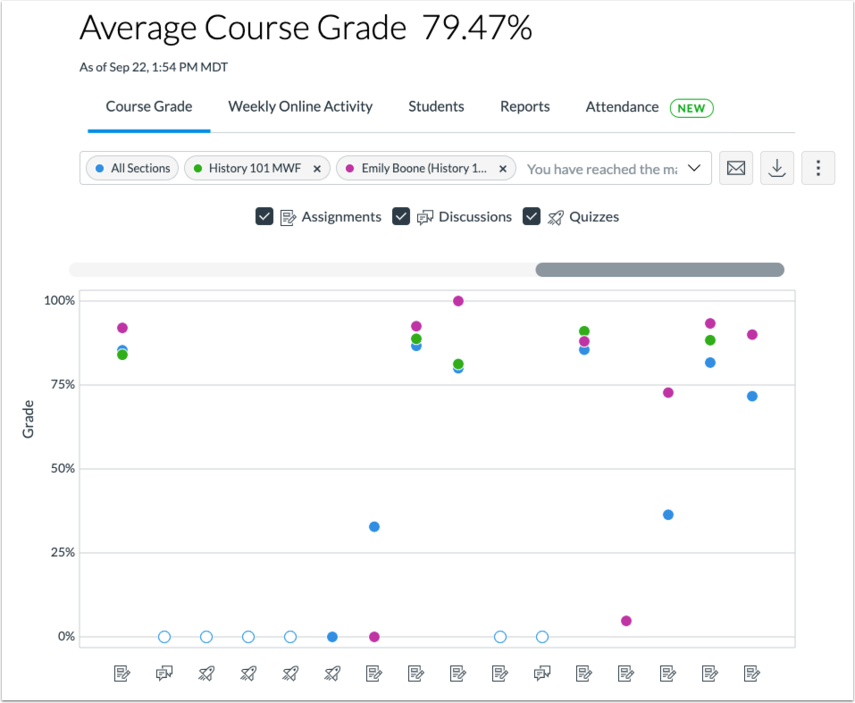
Currently, New Analytics allows instructors to track average course grades for student submissions using an interactive chart graph or table. Data is for viewing only and cannot directly be changed.
Page views and participation metrics include an aggregate across all devices, including Canvas mobile apps.
Use New Analytics to:
- View average course grade analytics as an interactive chart graph or a data table
- Compare the course average with an individual assignment, course section, or student filter using the chart graph comparison or data table comparison
- View average weekly online participation analytics as an interactive chart graph or a data table
- Compare the course average weekly online participation analytics with an individual student or section using the chart graph comparison or data table comparison
- Send a message to all students based on specific course grade or participation criteria
- Send a message to an individual student based on specific course grade or participation criteria
- View course grade and participation analytics for an individual student
- View and download reports on missing, late, or excused assignments, class roster, and course activity.
- View a report that displays if students have met online attendance criteria that has been selected by an admin.
